![iam small logo.png]](https://support.iamcompliant.com/hs-fs/hubfs/iam%20small%20logo.png?height=50&name=iam%20small%20logo.png)
This is a premium feature available with a full subscription to iAM Compliant.
To access the Insights reporting dashboard, you will need to have a full version of iAM Compliant and be assigned either Account Owner or Location Manager user permissions
By simply selecting your chosen report from the Insights datasets, you will find a section of filters available that allow you to tailor the format in which you view the results of your report according to your preferences.
For example, you can adjust the report's view, giving you the flexibility to select how you want the results to be displayed, whether by day, week, month, quarter, or year.
Simply select 'View by month' to change the view from the dropdown list of options.


If you'd like to view data for a single location, you can make use of the search bar at the top of the report by starting to type the location's name, and the results will be displayed accordingly. If you wish to filter your report to display results for multiple locations, select the 'Locations' option and mark the checkboxes listed in the dropdown menu.
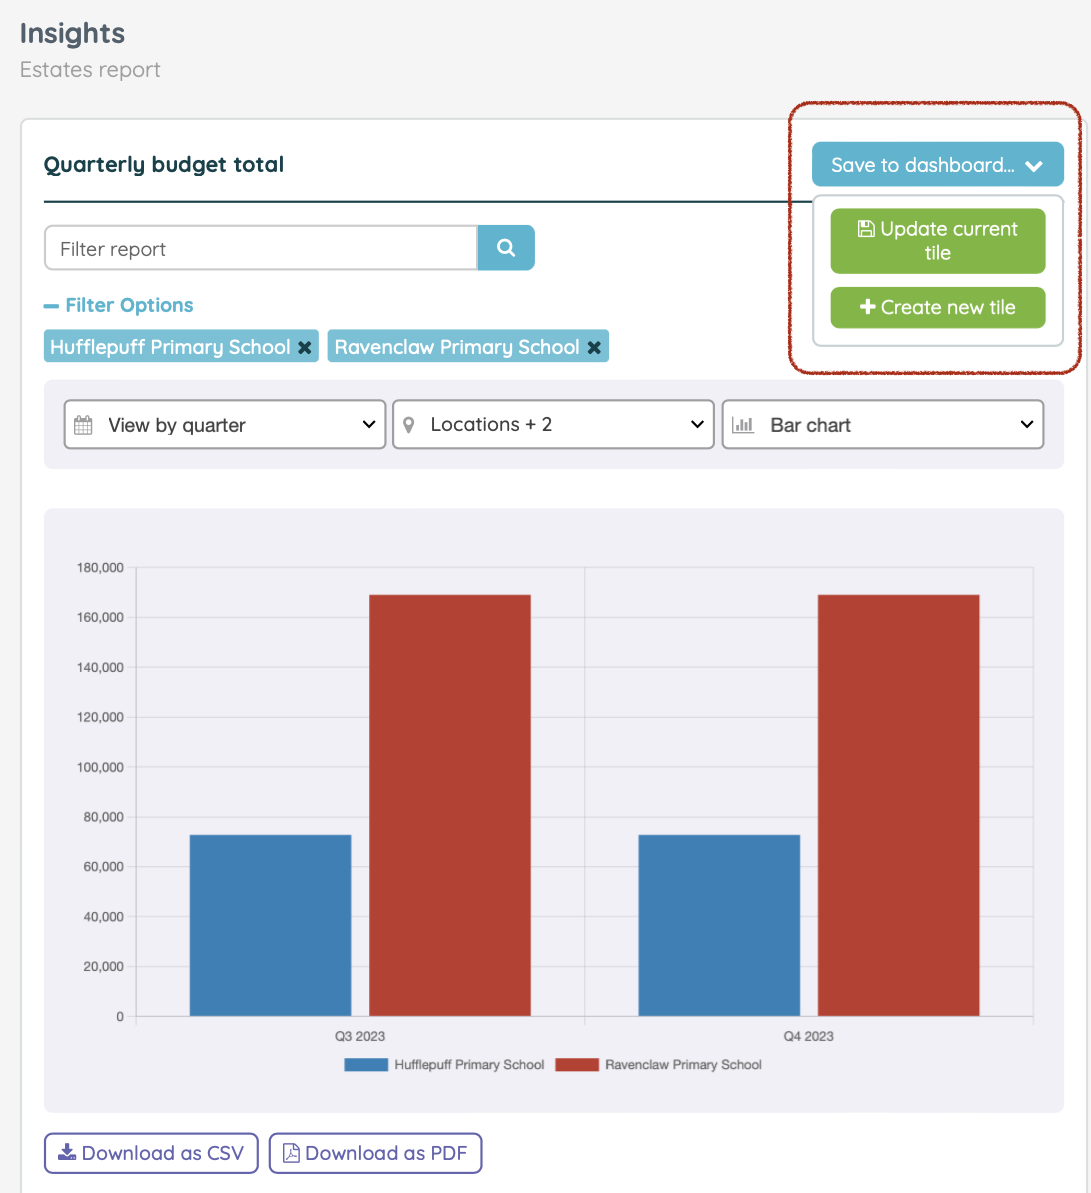
To change the display of the report into a different format, select the chart options where you can then choose to visualise your results through a bar chart, line chart, or doughnut chart format.


To save your customised report, select 'Save to dashboard'.
Here, you can opt to display your personalised report as a new tile on your dashboard or you can update an existing tile to replace a current report tile on your dashboard if required.